


Modern marine navigation relies on a combination of trustworthy charts, real-time vessel information, and constantly updated environmental data.
Out of NOAA (National Oceanic and Atmospheric Administration) that is the official Marine Nautical Charts producer, two of the most important additional sources of navigation data in the United States come from the U.S. Army Corps of Engineers (USACE) and the U.S. Coast Guard (USCG).
Let’s find out what USACE and USCG data are, why they are essential for navigation - especially along complex waterways like the Intracoastal Waterways - and how Aqua Map integrates them to enhance situational awareness at sea.
What are USACE and USCG key data for safer navigation? Roles and responsibilities
USACE
USACE is in charge of maintaining over 25.000 miles of federal navigation channels, rivers and inland waterways in general. This responsibility includes frequent surveys to collect depth information and detect shoaling caused by sediment accumulation.
These surveys are carried out with specialized vessels equipped with sonar systems, precise GPS positioning, and survey software that processes the collected data, allowing engineers to identify areas where depths have decreased and dredging may be required, while also creating a long-term record of how waterways change over time due to currents, storms, and sediment movement.
USCG
The USCG is in charge of maintaining aids to navigation (ATONs) such as buoys, lights, and daymarks and distributing operational information that helps mariners understand current conditions on the water.
Among the most relevant Coast Guard datasets integrated into Aqua Map are Light Lists, which describe the position and characteristics of navigation lights and other aids, and Local Notices to Mariners (LNMs), which alert boaters to temporary hazards, construction activities, or changes affecting navigation.
Together, USACE and USCG data provide a comprehensive layer of situational awareness, combining information about channel depths below with navigation infrastructure and safety updates above, helping mariners interpret their charts more effectively and navigate with greater confidence.
Why USACE and USCG data are critical along the Intracoastal Waterway
One of the areas where having access to USACE and USCG data becomes particularly valuable is the Intracoastal Waterway (ICW).
The ICW is a complex network of protected inland waterways running along the Atlantic and Gulf coasts of the United States. It is widely used by recreational cruisers, fishing vessels, and commercial traffic.
Despite being charted and maintained, the ICW presents several navigation challenges:
- shifting sandbars and sediment buildup;
- narrow channels with limited margins for error;
- strong currents and tidal variations in certain areas.
Shoaling can occur quickly, especially in areas where rivers bring sediment into the waterway or where storms reshape the seabed. As a result, the actual depth in a channel may differ from what appears on older charts.
This is where USACE hydrographic surveys become extremely valuable. Because they measure the actual depths of navigation channels, these surveys reveal where shoaling has occurred and where the deepest parts of the channel currently lie.
For mariners navigating the ICW, access to recent USACE survey data can make a significant difference. Updated surveys help identify areas where depths may be reduced and allow boaters to plan safer routes through shallow or constantly changing sections of the waterway.
While USACE data helps mariners understand what is happening below the surface, USCG data is equally important for navigating the ICW safely at the surface level. The Intracoastal Waterway relies heavily on a dense system of aids to navigation, including buoys, beacons, and daymarks, which guide vessels through narrow and often winding channels.
However, these aids can be moved off position by storms, currents, or human activity, and conditions can change quickly due to maintenance work or temporary hazards. This is where USCG datasets - such as Light Lists and Local Notices to Mariners - become really essential.
In fact, Light Lists provide detailed and up-to-date information on the characteristics and positions of navigation aids, helping mariners correctly identify markers along the route, while LNMs alert boaters to recent changes, missing or damaged aids, dredging operations, or other risks that may not yet be reflected on charts.
For those navigating the ICW, having access to this constantly updated information is critical to avoid confusion, stay within the marked channel, and adapt to real-time conditions, significantly improving both safety and situational awareness.
In this scenario, Aqua Map is the only existing marine navigation app that integrates USACE with USCG datasets, thus making all the latest updates available to users within a single platform and ensuring that mariners can easily visualize them.
Real case scenario on the ICW: the challenging area of Lockwood Folly
The ICW could be considered a “border land” from a navigational responsibility point of view. Over the years, NOAA handed over the responsibility for ICW surveys to the USACE and USCG, even though NOAA remains the sole producer of nautical charts for those areas. As a matter of fact, NOAA charts for the ICW still report the original project depths and dredged areas from around 1940.
In this context, for both recreational boaters exploring coastal waters and professional mariners navigating busy waterways, the access to the USACE and USCG datasets represents a significant step forward in the evolution of digital navigation.
There are actually some scenarios in which the possibility of viewing the integration of these informations over NOAA hydrographic charts and NOAA buoys can really make a difference. In fact, some triggering areas, especially where shoaling is constant or changes and hazards are frequent, require regular USCG and USACE updates.
This type of area includes shallow coastal inlets and river mouths, which are quite common on the Intracoastal Waterway. One of them is surely Lockwood Folly Inlet, a short tidal river which empties into the Atlantic ICW in North Carolina. This is a notoriously difficult area to sail in, where having updated information from the USACE and USCG datasets can be crucial for mariners.
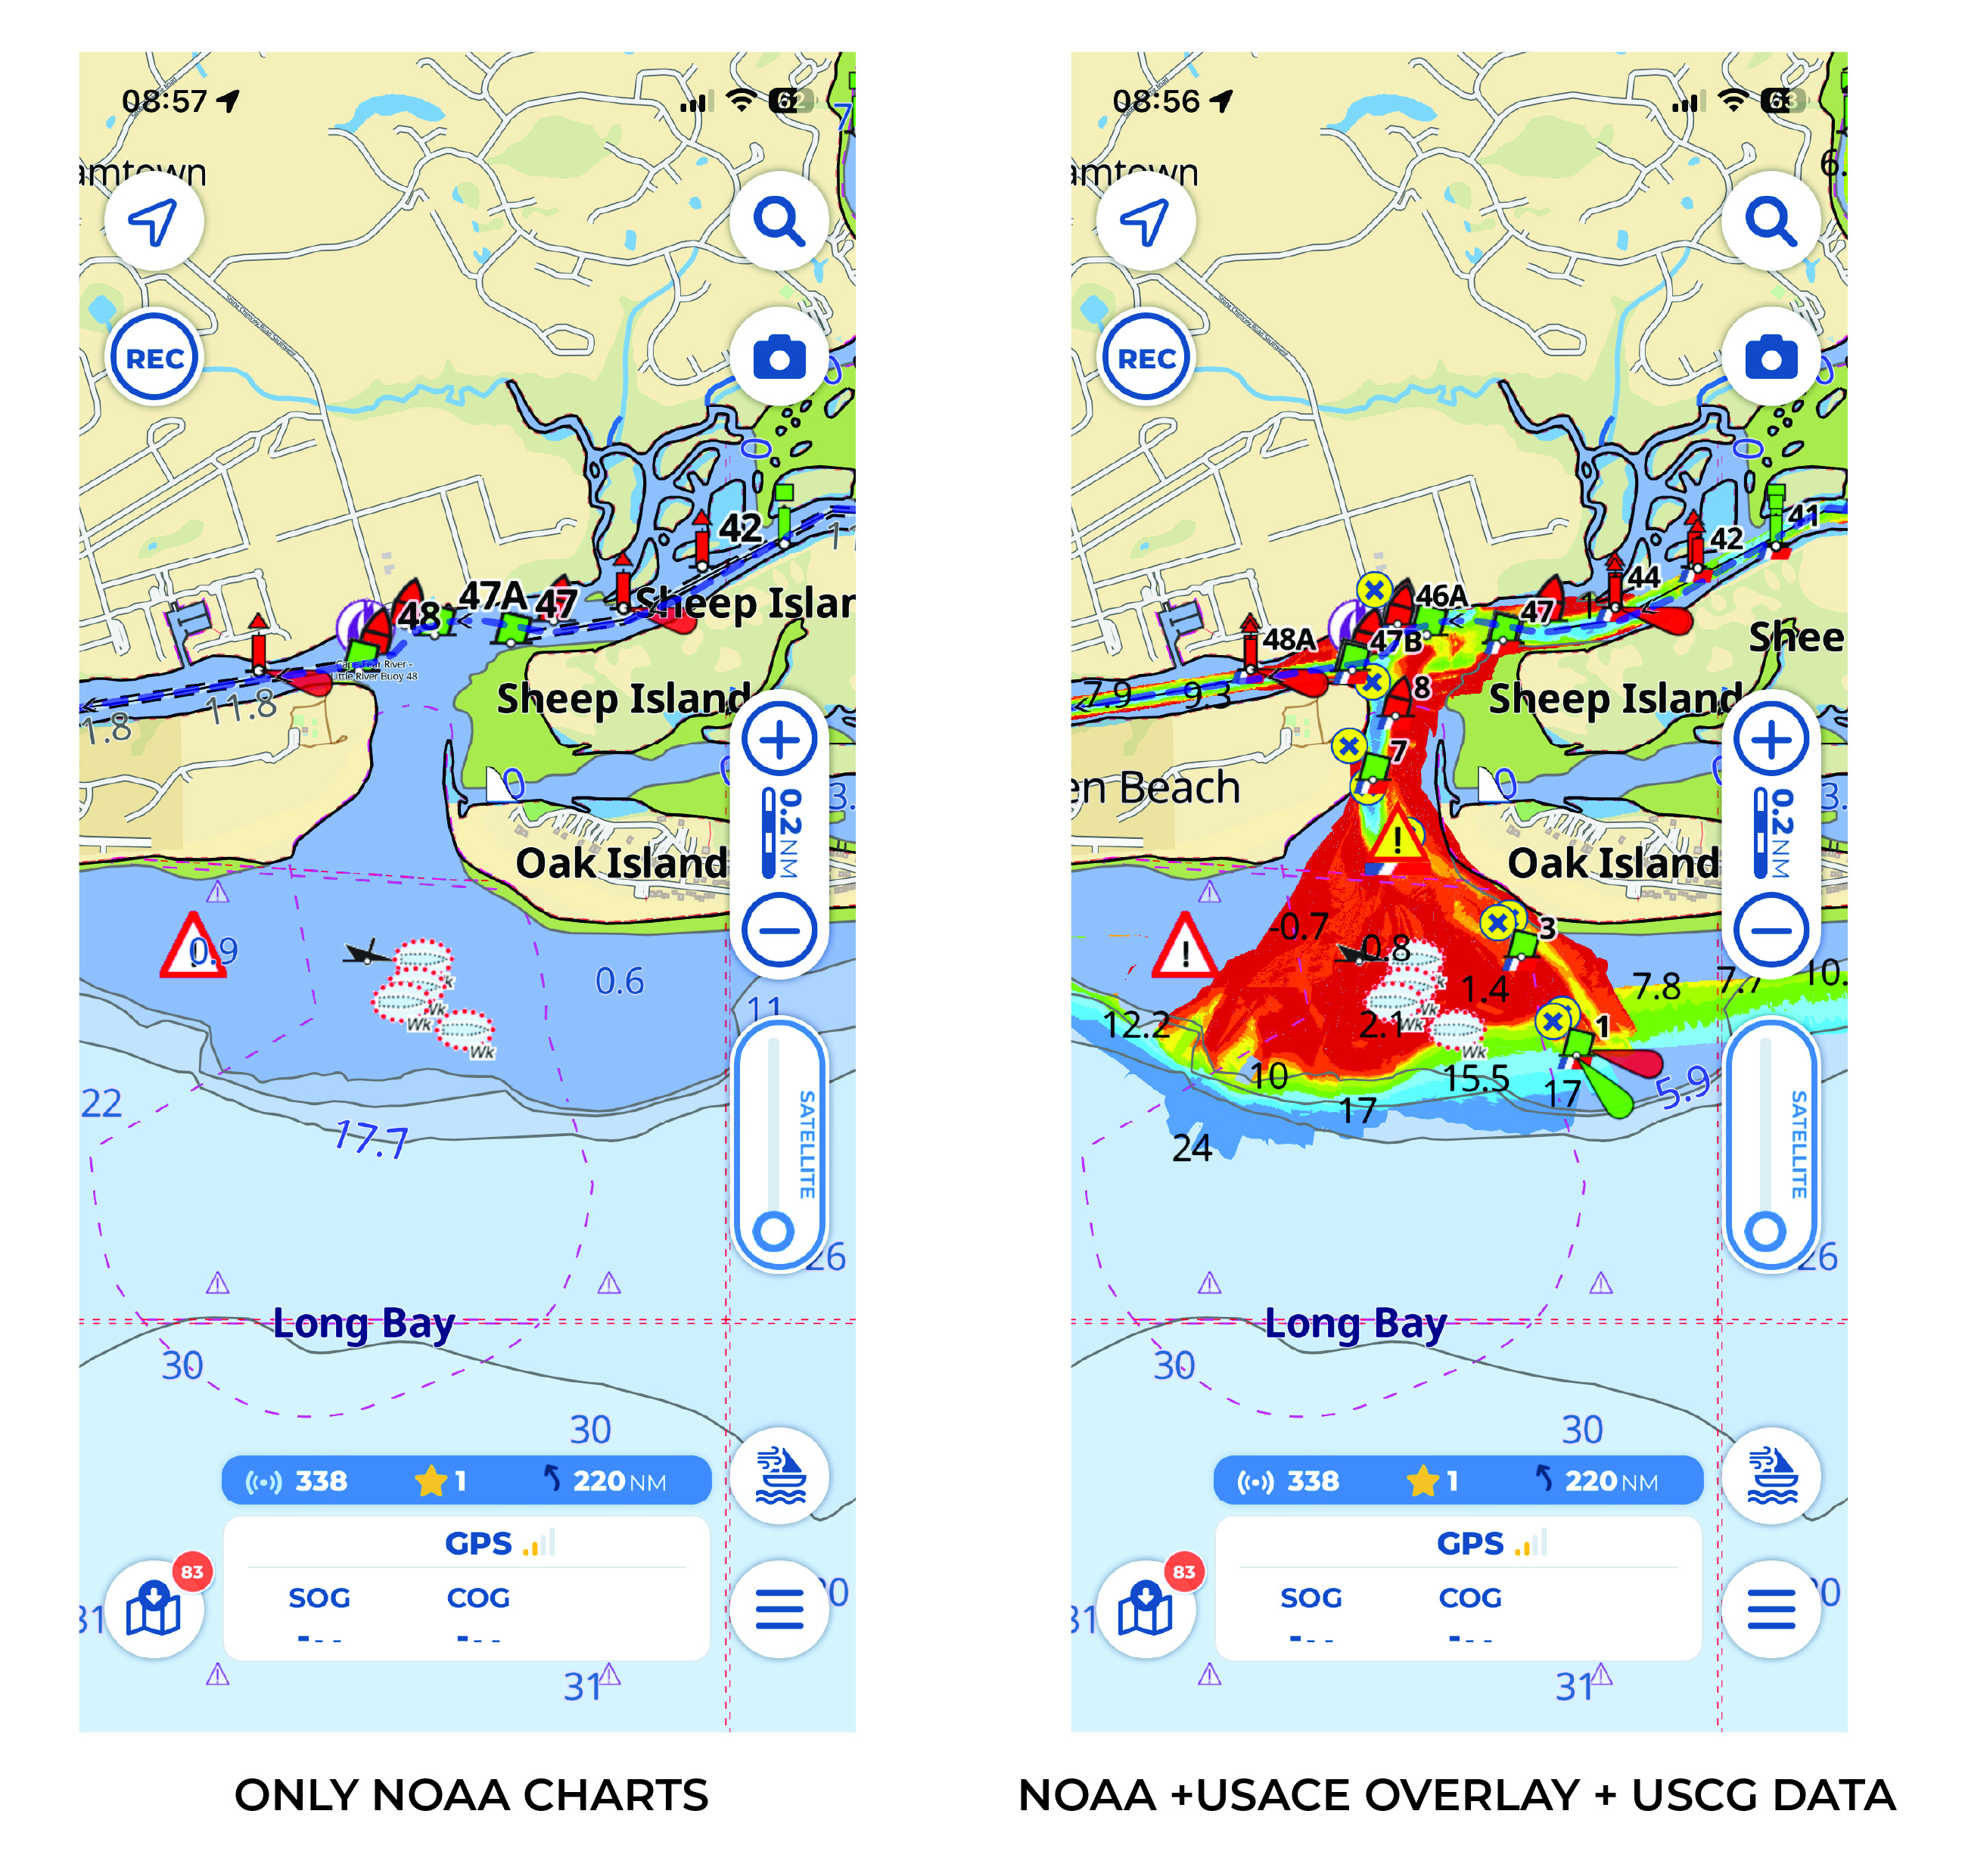
Here above there’s a visual example of the differences between the standard NOAA nautical charts and Aqua Map’s chart, which integrates them with the USACE and USCG datasets, in order to provide an essential layer of situational awareness for anyone navigating busy waterways.
Scenarios like Lockwood Folly Inlet in North Carolina is a clear example of an area where the overlaying of USACE and USCG data on Aqua Map’s charts makes a real difference. Relying on a standard NOAA chart, the inlet appears navigable, but this information cannot be considered completely accurate.
In fact, this chart alone doesn’t show, for instance, that the channel has shoaled significantly since the last survey, that a sandbar has shifted, or that a temporary hazard has been reported. Being able to layer in USACE hydrographic survey data and USCG LNMs, makes it possible to access a far more detailed and updated picture, including latest surveyed depths, known problem areas and active navigation alerts.
By using NOAA charts as the foundation and integrating on it both USACE and USCG datasets, mariners can rely on a level of accuracy, detail and currency that cannot be provided from a single data source if considered alone, making the overlay feature one of Aqua Map's most powerful tools.
In conclusion, some areas might look straightforward on a chart - just like Lockwood Folly Inlet -, but reveal their true complexity when navigating them. And this is why Aqua Map is the only platform that ensures all that information that could make a difference between sailing safely and running aground.
USACE and USCG data integration within Aqua Map: how to activate them
Modern navigation apps bring together multiple data sources to create a richer and more informative navigation environment. As we have seen, Aqua Map integrates both USACE hydrographic survey data and USCG navigation information, helping mariners access critical information directly on their charts.
Within the app, these navigation layers can be activated through the Local Data tools, allowing users to display additional data directly on the chart. Once enabled, the system overlays the information on top of existing charts, giving users access to both underwater survey data and operational safety information in a single interface.
The integration of USACE data allows Aqua Map users to visualize available hydrographic surveys directly within the chart environment. Instead of searching external databases, users can quickly identify areas where detailed channel surveys are available and review the latest depth measurements. This feature is particularly useful in shallow or frequently changing waterways like the Intracoastal Waterway.
Aqua Map also allows users to customize the visualization of the surveys overlaid on the charts.
With the option Select max age, users can choose the maximum age of surveys to be overlaid on the map, among four visualizations:
- "All" (no filter, all surveys will be drawn);
- "3yr" (do not display surveys older than 3 years);
- "1yr" (do not display surveys older than 1 year);
- "months" (a specific number of months to be used as a filter).
Finally, the Enable fading option enables the fading of USACE surveys, making older surveys more transparent. This helps provide a better understanding of the surveys' age just by looking at the map.
Aqua Map also integrates several USCG data services that enhance situational awareness while navigating, including official navigation updates that help mariners stay aware of changes affecting navigation safety.
In fact, the USCG districts publish daily the updated List of Lights and also provide very frequent updates (multiple per day) of the Local Notices to Mariner, informing boaters about shoaling, dredging, events, and other important changes.
Both these updates are included in the Aqua Map, thus ensuring that captains receive timely information about changes in navigational aids and have the details they need for a safe journey, exploiting the following settings:
- Display Coast Guard - LNMs: shows all the LNM from the USCG directly on the map, also allowing users to search for them in the search section;
- Display Coast Guard - Navaids: displays the USCG buoys from the "List of Lights" on the map;
- NOAA navaids display: allows users to choose how to display the standard navigation aids from NOAA charts when USCG buoys are shown, which is very useful since NOAA buoys may “conflict” with USCG buoys (NOAA uses the USCG List of Lights but updates them less frequently, therefore USCG navaids are generally more accurate).
In particular, when the Display Coast Guard - buoys option is activated, all buoys, beacons, and lights provided by the USCG appear on the map, being identified by icons that are similar to NOAA's, but each USCG buoy includes a small USCG flag at the bottom to distinguish it from standard NOAA symbols.
Besides, an info icon may appear at the top-left to indicate specific situations, namely Navigation alert (potential navigation hazard), Missing aid (a buoy should be present but is currently missing), Out of position aid (a buoy has moved from its expected position), General information (useful navigation information) and Temporary aid (temporary buoy that will be removed soon).
This combined approach reflects the reality of modern navigation: safe boating depends not only on charts, but also on the continuous integration of environmental, operational, and infrastructure data. Understanding what USACE and USCG data represent helps explain why they are such powerful tools for modern navigation.
When these datasets are integrated into modern charting systems like Aqua Map, mariners gain a more complete understanding of the environment around them. The result is improved situational awareness, better route planning, and ultimately safer navigation.

